Aspects of sampling and modeling riparian forest structure
Monitoring riparian areas is complex, and requires detailed measurement and analyses of riparian structure over time. The high within- and among-riparian variations contribute to the difficulty of quantifying and connecting riparian structure to ecosystem drivers. With a range of projects, we provided insights into aspects of sampling and modeling riparian over- and understory vegetation, windthrow, and microclimate.
In riparian ecosystems, forest structure varies widely as a result of differences in tree distribution patterns, species composition, and differentiation in vertical (e.g., height diversity), horizontal (e.g., light, moisture, nutrient availability, gaps), and temporal dimensions. This variability is a key driver, exerting strong influence on functions and attributes such as large wood recruitment, microclimate, water quality, and presence and abundance of flora and fauna.
Riparian overstory vegetation structure
Marquardt et al. (2010) evaluated the performance of different sampling designs to quantify stand structure in riparian areas. Rectangular strip plots outperformed all other plot shapes in estimating trees per hectare and basal area per hectare, with 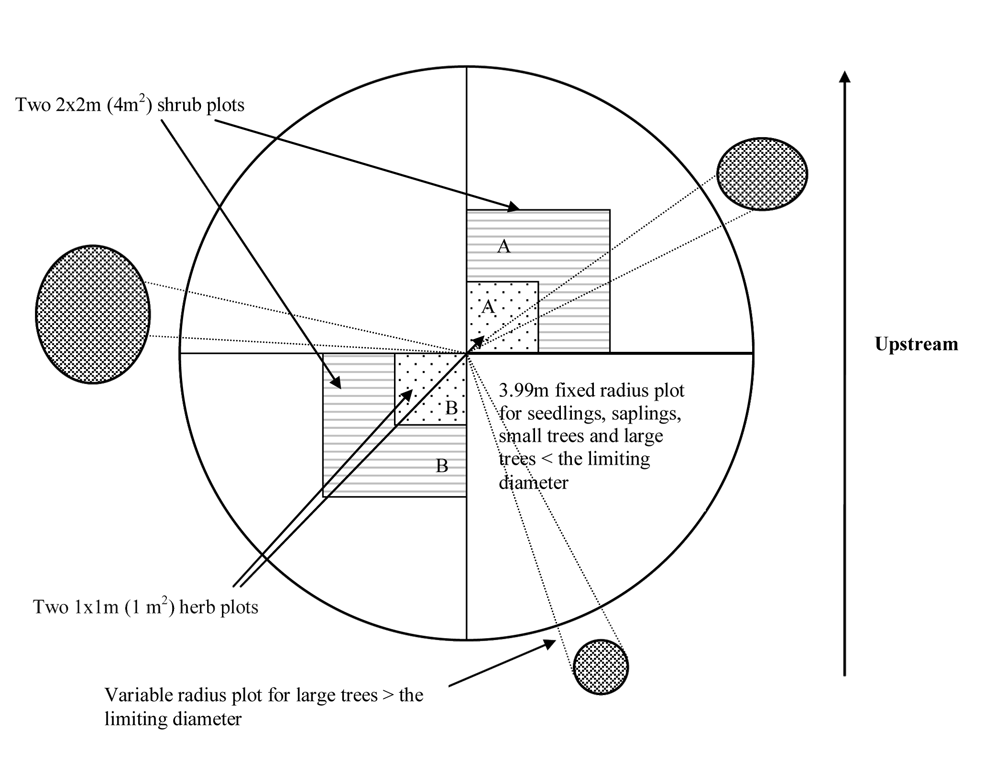 strips oriented perpendicular to the stream outperforming those oriented parallel to the stream.
This research was funded by the USDA Forest Service, PNW Research Station, and conducted in collaboration with Dr. Paul Anderson.
Haxton (2010) compared n-tree distance sampling, with fixed and variable radius plot sampling for estimating density and basal area in riparian areas. N-tree distance sampling did not perform well in riparian stands with clumped spatial pattern.
This research was funded by USGS and conducted in collaboration with Dr. Joan Hagar (USGS).
Windthrow in riparian areas
Drake (2008) developed a two-step regression model to predict the presence of windthrow in riparian areas and quantify windthrow occurrence. Elevation was found to be the most significant predictor of windthrow, and windthrow was found to be inversely related to the distance from stream channel.
 This research was funded by the Fish and Wildlife Steering Committee and conducted in collaboration with Dr. Paul Anderson (USDA Forest Service).
Riparian microclimate
Eskelson et al (2011) modeled air temperature in riparian zones as a function of distance to stream, height above stream, and variables that describe the percent cover of understory and overstory vegetation layers using kriging with external drift (KED). Height above stream and distance to stream were the most important covariates in the KED models. Sample patterns were optimized based on the kriging variance and the weighted means of shortest distance criterion. For small sample sizes, the optimized sample patterns outperformed systematic sample patterns in terms of mean kriging variance.
This research was funded by USGS and conducted in collaboration with Drs. Paul Anderson and Joan Hagar.
Riparian understory vegetation
Eskelson et al (2011) examined the performance of ordinary least squares regression (OLS), beta regression, and a spatial Gaussian copula model to estimate abundance of shrub cover in riparian forests as a function of distance to stream and leaf area index. The OLS model resulted in biased predictions of shrub cover, while the beta regression and copula models provided unbiased predictions. Another drawback of the OLS model with log-transformed response is the interpretation of the parameter estimates that is not straightforward on the original scale of the response. With the beta regression model, dependence is modeled as correlation, which is strictly linear dependence. The copula model on the other hand models monotone dependence rather than correlation, which facilitates the interpretation of strength of dependence.
This research was funded by USGS and conducted in collaboration with Drs. Lisa Madsen (OSU, Department of Statistics) and Joan Hagar (USGS).
Abundance of Snags and Cavity Trees
Snags and cavity trees are significant structural components of many forest ecosystems. They provide nesting, foraging, and roosting habitat for a variety of wildlife species that depend on snags, large trees, and cavity trees for survival and reproduction. Both the creation of snags and cavity trees are governed by episodic events and stochastic processes (e.g., insect outbreaks or fire, disease, mechanical/chemical injury). Due to this snag and cavity tree abundance are highly variable even among forest stands that are similar in many other aspects. The performance of Most Similar Neighbor (MSN) imputation methods for imputing cavity tree abundance from stand attributes in forests of western Oregon and Washington was explored (Temesgen et al. 2008). Site index and percent composition of conifers was negatively correlated with cavity tree abundance, while stand density, quadratic mean diameter and percent composition of hardwoods showed positive correlation. Square root and logarithmic transformations of the response were compared. MSN imputation with square root transformed response resulted in lower root mean square values than using the untransformed response. In another study (Eskelson et al. 2009) negative binomial regression models and nearest neighbor imputation methods were compared for their suitability and predictive abilities to estimate snag and cavity tree abundance. MSN outperformed negative binomial regression models in predicting overall cavity tree and snag abundance. For predicting cavity tree and snag abundance at stand level, nearest neighbor imputation methods resulted in large over- and underpredictions, while negative binomial regression models only resulted in large underpredictions.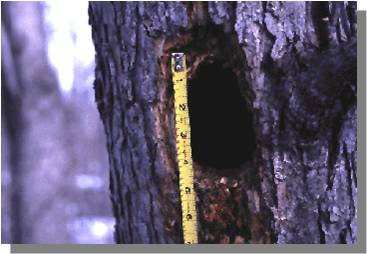
Our work on snag and cavity tree abundance provides improved model predictions of snag and cavity tree abundance, which will facilitate wildlife habitat assessment and management as well as wildlife habitat mapping efforts.
This research was funded by the USDA Forest Service, PNW FIA, and conducted in collaboration with Dr. Tara Barrett and Greg Latta.
Small Area Estimation Methods for Improving Estimates of Selected Forest Attributes
Goerndt (2010) assessed the strength of light detection and ranging (LiDAR) as auxiliary information for estimating selected forest attributes (number of trees/ha, basal area/ha, volume/ha, quadratic mean diameter, Lorey’s height) using area-level LiDAR metrics and single tree crown segmentation (STRS). LiDAR intensity metrics were useful for increasing precision for trees/ha. With the exception of Lorey’s height, STRS did not significantly improve precision for most of the attributes. Small area estimation techniques were assessed for precision and bias in estimating stand-level forest attributes (trees/ha, basal area/ha, volume/ha, quadratic mean diameter, mean height of 100 largest trees/ha) assuming a localized subpopulation using LiDAR auxiliary information. Selected estimation methods included area-level regression-based composite estimators and indirect estimators based on synthetic prediction and nearest neighbor imputation. The composite estimators produced lower bias and higher precision than synthetic prediction and imputation. The traditional composite estimator outperformed empirical best linear unbiased prediction in terms of bias but not precision.
This research was funded by the USDA Forest Service, PNW FIA, and conducted in collaboration with Dr. Vicente Monleon.
Status and change estimation of forest attributes from paneled inventory data
Several nearest neighbor imputation methods were examined for their suitability and predictive abilities to update plot-level forest attributes to the current year. When the most recent measurements of the variables of interest were used as ancillary data, Random Forest imputation outperformed the moving average in terms of bias and root mean square error (Eskelson et al. 2009, For. Sci. 55(1):64-71). Updating unmeasured panels to the current year with imputed mean annual change resulted in more accurate estimates than those obtained by plot-level imputation (Eskelson et al. 2009, Silva Fennica 43(4):649-658).
This research was funded by the USDA Forest Service, PNW FIA, and conducted in collaboration with Dr. Tara Barrett.
Taper, Crown, and Volume Responses of a Coastal Oregon Douglas-fir Stand to Sulfur Treatments for Control of Swiss Needle Cast
For nearly two decades, foresters in the Oregon Coast Range have been witnessing a substantial decrease in Douglas-fir (Pseudotsuga menziesii var. menziesii [Mirb.] Franco.) vigor and growth, caused by Swiss needle cast (Phaeocryptopus gaeumannii). Currently, no solutions are in sight but aerially-applied sulfur may alleviate Swiss needle cast and its growth impacts. In this trial, three treatments were imposed on Douglas-fir trees infected with Swiss needle cast; 1) sulfur, 2) sulfur + nutrients, and 3) no treatment. Volume growth, taper, and other responses to treatments were examined using stem analysis data extracted from 120 sample trees. Using a variable exponent taper model, it was determined that trees within the sulfur treatment did not have a significantly different taper from the control, whereas the sulfur + nutrient treatment did show decreased taper when compared to the control. This change in taper in the sulfur + nutrient trees however, has not translated into a significant merchantable volume. For details see Younger et al. (2007).
This research was funded by Starker Forests Inc. of Corvallis.